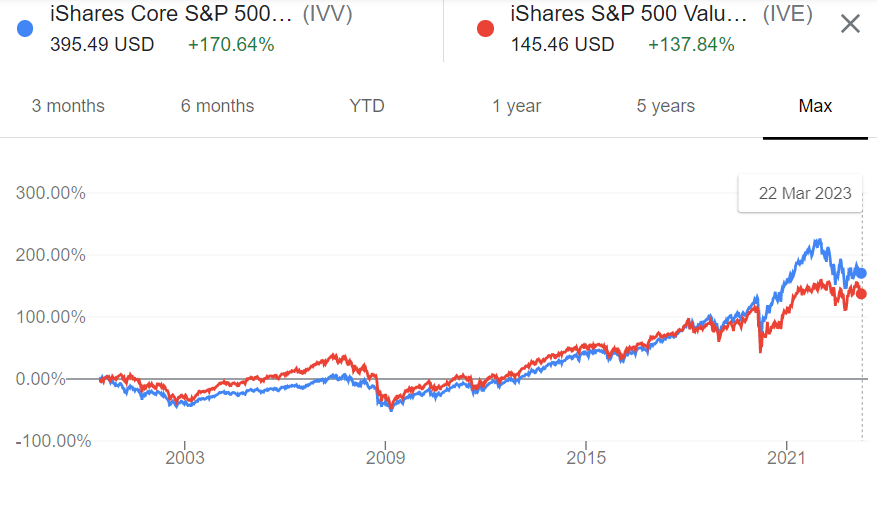
IVV vs. IVE – Which One is Better?
We’re going to do a deep dive into IVV vs IVE and focus on the most important parts like performance, top holdings, dividends and expense ratios.
The iShares Core S&P 500 ETF (IVV) and the iShares S&P 500 Value ETF (IVE) are both ranked in the Top 100 ETFs. But what separates IVV from IVE? And which of these funds is superior?
To start off with, IVV is an Large Blend fund, IVE Large Value fund.
IVV has a much lower expense ratio compared to IVE, 0.03% vs. 0.18%.
IVV also has a greater exposure to the technology sector and a lower standard deviation. Over the past ten years, IVV has outperformed IVE in terms of returns.
In this article, we will conduct a comparative analysis of IVV vs. IVE. We will examine their portfolio composition and growth, as well as their holdings and yearly returns. Additionally, we will explore IVV’s and IVE’s industry exposure, risk metrics, and performance, and analyze how these factors influence their overall returns.
The Basics
IVV (iShares Large Blend Fund) has total assets under management of 294.95B. Over the past ten years, it has provided an average annual return of 14.48%. Additionally, the fund offers a dividend yield of 1.28% and has a low expense ratio of 0.03%.
On the other hand, IVE (iShares Large Value Fund) has total assets under management of 22.4B. Over the past decade, it has provided an average annual return of 11.68%. The fund also offers a higher dividend yield of 1.88%, but its expense ratio is relatively high at 0.18%.
| Name | IVV | IVE |
| Category | Large Blend | Large Value |
| Issuer | iShares | iShares |
| Market Cap | 294.95B | 22.4B |
| Avg. Return | 14.48% | 11.68% |
| Dividend | 1.28% | 1.88% |
| Expense Ratio | 0.03% | 0.18% |
Top Holdings
The Technology sector holds the highest exposure in the iShares Core S&P 500 ETF (IVV) with a percentage of 24.64%. This is followed by Financial Services and Healthcare at 13.86% and 13.52% respectively. The remaining sectors such as Utilities (2.49%), Energy (2.55%), and Real Estate (2.63%) have a combined total of only 7.67% of the fund’s total assets.
IVV’s mid-section, which has moderate exposure, consists of Consumer Defensive, Industrials, Communication Services, Consumer Cyclical, and Healthcare stocks with 6.34%, 8.73%, 11.24%, 11.74%, and 13.52% respectively.
On the other hand, the iShares S&P 500 Value ETF (IVE) has the Financial Services sector as its highest exposure, with a percentage of 22.06%. Healthcare and Industrials follow closely behind at 15.4% and 12.19%, respectively. Real Estate (4.38%), Utilities (4.82%), and Energy (5.43%) only make up 14.63% of the fund’s total assets.
IVE’s mid-section, which has moderate exposure, consists of Communication Services, Consumer Cyclical, Consumer Defensive, Technology, and Industrials stocks with 6.4%, 7.68%, 9.23%, 9.41%, and 12.19% respectively.
Performance
When comparing the performance of the IVV and IVE ETFs, we can see that IVV had a higher CAGR (Compound Annual Growth Rate) of 14.48% compared to IVE’s 11.68%. This means that over the given time period, IVV had a higher average annual growth rate than IVE.
| Year | IVV | IVE |
|---|---|---|
| 2020 | 18.37% | 1.24% |
| 2019 | 31.44% | 31.71% |
| 2018 | -4.42% | -9.09% |
| 2017 | 21.79% | 15.19% |
| 2016 | 11.9% | 17.17% |
| 2015 | 1.34% | -3.24% |
| 2014 | 13.62% | 12.14% |
| 2013 | 32.31% | 31.69% |
| 2012 | 15.91% | 17.45% |
| 2011 | 2.03% | -0.63% |
| 2010 | 14.96% | 14.9% |
$10,000 Investment
In terms of final balance, IVV had a higher return with a final balance of $41,976 compared to IVE’s final balance of $31,350. However, it is important to note that past performance does not guarantee future results and that investment decisions should be made based on a variety of factors such as investment goals, risk tolerance, and market conditions.
| Fund | Initial Balance | Final Balance | CAGR |
|---|---|---|---|
| IVV | $10,000 | $41,976 | 14.48% |
| IVE | $10,000 | $31,350 | 11.68% |
IVV vs IVE The Final Verdict
Both IVV and IVE are popular ETF options for investors looking to gain exposure to the S&P 500 index, and while both funds track the same underlying index, they have some key differences in their holdings and performance.
IVV, with its focus on growth-oriented companies in the technology sector, has outperformed IVE in terms of returns over the past decade. On the other hand, IVE, with its emphasis on value-oriented companies in financial services and healthcare sectors, may be better suited for investors looking for a more defensive approach to the market.
Ultimately, the choice between IVV and IVE will depend on an individual’s investment objectives and risk tolerance. Both funds offer investors a cost-effective and efficient way to gain exposure to the broad market, and can be a valuable addition to a diversified investment portfolio.

