SPY vs SCHX: Which ETF Is Better?

SCHX vs SPY – both of these funds are US Large Cap ETFs. But what is the biggest difference and how does their performance compare?
SPY is the Coca Cola of the ETF world. It was the first ETF listed on the NYSE in 1993 and has the largest amount of assets under management with over $400 Billion USD.
SPY’s mission (if it chooses to accept it) is simple, to track the Largest 500 Publicly Listed US Companies. However, due to its size, reputation (and cool name), SPY is able to charge higher fees with an annual expense ratio of .09%.
SCHX is Schwab’s Large Cap ETF fund which has over $30 Billion USD under management and has been around since 2009. SCHX tracks the Dow Jones U.S. Large-Cap Index and has a an expense ratio of only .03%.
So is it worth it to go with a lower cost ETF like Charles Schwab’s SCHX or stick with the OG, SPY?
SCHX vs SPY Comparison
| Name | Category | Issuer | M Cap | Avg. Return | Div. Yield | Expense Ratio |
|---|---|---|---|---|---|---|
| SPDR S&P 500 ETF Trust (SPY) | Large Blend | SPDR State Street Global Advisors | $374.03B | 14.41% | 1.3% | 0.09% |
| Schwab U.S. Large-Cap ETF (SCHX) | Large Blend | Schwab | $30.89B | 14.60% | 1.41% | 0.03% |
SPY is an ETF that tracks the S&P 500 index, which is composed of the 500 largest publicly traded companies in the US. The SPY ETF was launched in 1993 and has since become the largest ETF in the world, with almost $400 billion in assets under management.
SCHX, on the other hand, is an ETF that tracks the Dow Jones U.S. Large-Cap Total Stock Market Index, which includes approximately 750 of the largest publicly traded companies in the United States. The ETF was launched in 2009 and has over $30 billion in assets under management.
SPY is also sometimes (mistakenly) referred to as SPDR because it is the first and largest ETF launched by Standard & Poor’s Depositary Receipt or SPDR. SPDR has many ETFs under its umbrella, not just SPY (please feel free to use this little factoid the next time you want to bore someone at a coctail party).
SCHX is Schwab’s Large Cap Fund and is the closest ETF that they have to SPY which tracks the S&P 500. But instead of tracking the Largest 500 Companies, SCHX Index tracks the Largest 750 Companies making it more diversified and slightly less reliant on the large tech companies that dominate.
For example, the top 10 holdings make up 27.11% of SPY, while the top 10 holdings of SCHX make up 25.2%.
Which ETF Has the Better Expense Ratio
One of the key factors to consider when comparing ETFs is the expense ratio, which is the annual fee that the ETF charges investors to manage the fund.
The expense ratio for SPY is 0.09%, while the expense ratio for SCHX is 0.03%.
Don’t get me wrong these are both incredibly low, especially when compared to traditional Mutual Funds which charge upwards of 1%.
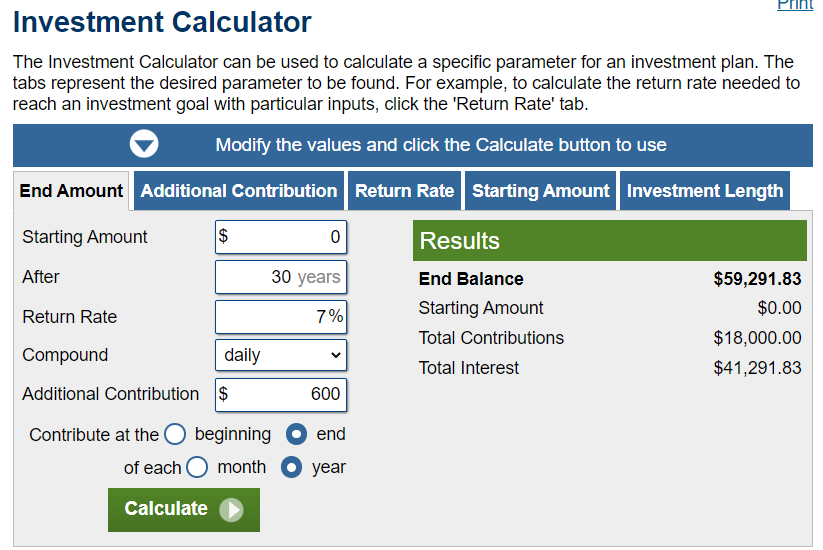
But that .06% difference adds up in the long run. Let’s say that you have $1,000,000 to invest, with SPY you will pay an extra $600.00 per year in expenses. If you were to keep that $600 bucks invested over a 30 year period with a 7% annualized return, then you will have an extra $59,291.83!
SCHX vs SPY Which Has Better Performance
Another important factor to consider is the historical performance of the ETFs.
Over the past 10 years, SPY has had an average annual return of 14.57%, while SCHX has had an average annual return of 14.49%. While there is a slight difference in performance, it is not significant enough to make a clear winner.
SPY vs SCHX Top Holdings
SPY tracks the S&P 500 index which means it has the Top 500 US Publicly Listed Companies in its index. SCHX is going to be slightly more diversified with the Top 750 Companies.
The amounts to SPY being more heavily weighted towards the technology, healthcare, and financial sectors. The top holdings in SPY include companies like Apple, Microsoft, Amazon, and Facebook.
SCHX, on the other hand, tracks the Dow Jones U.S. Large-Cap Total Stock Market Index, which is more diversified across sectors. The top holdings in SCHX include companies like Apple, Microsoft, Johnson & Johnson, and Procter & Gamble.
SCHX vs SPY Which Has Better Performance
Another important factor to consider is the historical performance of the ETFs.
Over the past 10 years, SPY has had an average annual return of 14.41%, while SCHX has had an average annual return of 14.6%. While there is a slight difference in performance, it is not significant enough to make a clear winner.
Here’s what would happen if you invested $10,000 into each fund for the past 10 years:
| ETF | Starting Balance | Fiishing Balance | Avg Return |
|---|---|---|---|
| SPY | $10,000 | $36,293 | 14.41% |
| SCHX | $10,000 | $36,987 | 14.60% |
SPY vs SCHX Top Holdings
SPY tracks the S&P 500 index which means it has the Top 500 US Publicly Listed Companies in its index. SCHX is going to be slightly more diversified with the Top 750 Companies.
The amounts to SPY being more heavily weighted towards the technology, healthcare, and financial sectors. The top holdings in SPY include companies like Apple, Microsoft, Amazon, and Facebook.
SCHX, on the other hand, tracks the Dow Jones U.S. Large-Cap Total Stock Market Index, which is more diversified across sectors. The top holdings in SCHX include companies like Apple, Microsoft, Johnson & Johnson, and Procter & Gamble.
| Company | Percentage | |
|---|---|---|
| Apple Inc. | 7.03% | |
| Microsoft Corporation | 6.21% | |
| Amazon.com Inc. | 2.68% | |
| NVIDIA Corporation | 1.92% | |
| Alphabet Inc. Class A | 1.81% | |
| Berkshire Hathaway Inc. Class B | 1.64% | |
| Alphabet Inc. Class C | 1.61% | |
| Tesla Inc. | 1.49% | |
| Meta Platforms Inc. Class A | 1.39% | |
| UnitedHealth Group Incorporated | 1.33% | |
| Total Percentage: | 27.11% | |
| Company | Percentage | |
|---|---|---|
| Apple Inc. | 6.5% | |
| Microsoft Corporation | 5.8% | |
| Amazon.com Inc. | 2.5% | |
| NVIDIA Corporation | 1.8% | |
| Alphabet Inc. Class A | 1.7% | |
| Berkshire Hathaway Inc. Class B | 1.5% | |
| Alphabet Inc. Class C | 1.5% | |
| Tesla Inc. | 1.4% | |
| Meta Platforms Inc. Class A | 1.3% | |
| UnitedHealth Group Incorporated | 1.2% | |
| Total Percentage: | 25.2% | |
SCHX vs SPY Sectors
| SPY | SCHX | |
|---|---|---|
| Technology | 24.22% | 25.13% |
| Industrials | 8.86% | 8.65% |
| Energy | 2.86% | 2.72% |
| Communication Services | 11.14% | 11.26% |
| Utilities | 2.45% | 2.37% |
| Healthcare | 13.09% | 13.04% |
| Consumer Defensive | 6.32% | 5.97% |
| Real Estate | 2.57% | 3.13% |
| Financial Services | 14.23% | 13.82% |
| Consumer Cyclical | 12.0% | 11.63% |
| Basic Materials | 2.27% | 2.28% |
Liquidity
Liquidity basically just means that there are a lot of people buying and selling a certain stock, ETF, etc. at any given time. Because SPY has a larger trading volume than SCHX, it will have higher liquidity.
SPY is the most traded ETF in the world, with an average daily trading volume of over 50 million shares. While SCHX has a lower trading volume, with an average daily trading volume of just over 1 million shares.
But the real question is, how does this affect you as an investor? 1 million shares is still a lot, as of March 20th, 2023, the current price of SCHX is $46.23 so each day SCHX sees over $46,000,000 worth of trading. For the average buy and hold investor, SCHX has an extremely high amount of liquidy. But it might be insufficient for large institutions that move millions of dollars in and out of funds a day.
SCHX vs SPY the Final Verdict
To sum it all up, both SPY and SCHX are excellent ETFs that provide exposure to large-cap U.S. stocks.
SPY has a longer track record and higher trading volume, SCHX has a lower expense ratio and more diversified portfolio.
Ultimately, the choice between the two ETFs will depend on your investment objectives and risk tolerance.
If you are looking for a low-cost ETF that provides exposure to a diversified portfolio of large-cap U.S. stocks, SCHX may be the better choice. If you value liquidity and prefer to invest in a more heavily weighted index, SPY may be the better option.
Frequently Asked Questions
1) What is the SCHX ETF?
The SCHX ETF is an exchange-traded fund that aims to track the performance of the Dow Jones U.S. Large-Cap Total Stock Market Index, which includes large-cap U.S. companies across all sectors.
2) Who manages the SCHX ETF?
The SCHX ETF is managed by Charles Schwab Investment Management, Inc.
3) What is the expense ratio for the SCHX ETF?
The expense ratio for the SCHX ETF is 0.03%, which is relatively low compared to other ETFs in its category.
4) What is the dividend yield for the SCHX ETF?
The dividend yield for the SCHX ETF varies over time, but it is currently around 1.4%.
5) How has the SCHX ETF performed historically?
Historical performance of the SCHX ETF shows that it has generally performed in line with the overall U.S. large-cap stock market. Its returns have been consistent and generally positive over the long term, although it may experience fluctuations in the short term. As with any investment, past performance does not guarantee future results.
6) Is SCHX a Good Investment?
If your goal is to invest in Large Cap US Stocks with a low expense ratio, then SCHX is a ETF for that purpose.

