Bond Funds have been an important part of a diversified investment portfolio for decades. And while the Bond Market has suffered a lot in 2022 and 2023 with rising interest rates, investors still need a place to invest “cash” which is why we’re taking a look at two of the biggest bond funds – BND vs BNDX.
BND and BNDX are both popular options for fixed-income investors. Both of these ETFs offer exposure to bond markets, but with different approaches.
In this article, we’ll explore the basics of BND and BNDX, their top holdings, performance, annual returns, dividend, and expense ratio, so you can make an informed decision.
The Basics
| Name | BND | BNDX |
| Index | Barclays Capital U.S. Aggregate Bond Index | Barclays Global Aggregate Bond Index |
| Expense Ratio | 0.035% | 0.08% |
| Issuer | Vanguard | Vanguard |
| Structure | ETF | ETF |
| Inception Date | 4/10/2007 | 4/6/2013 |
| AUM | $53.8B | $27.1B |
| Holdings | 9,398 | 6,175 |
BND tracks the Bloomberg Barclays U.S. Aggregate Bond Index, which includes a broad range of investment-grade U.S. bonds. It has a relatively low expense ratio of 0.04%, making it an attractive option for long-term investors.
BNDX tracks the Bloomberg Barclays Global Aggregate ex-USD Float Adjusted RIC Capped Index, which includes investment-grade bonds from around the world, excluding the United States. Its expense ratio is slightly higher at 0.20%, but it offers exposure to a broader range of international bonds.
Top Holdings
The top holdings of BND include U.S. Treasury bonds, mortgage-backed securities, and corporate bonds from companies like Apple and Microsoft.
In contrast, the top holdings of BNDX include Japanese and European government bonds, as well as bonds from international corporations such as Toyota and Nestle. Both ETFs provide a diversified mix of bonds that help to mitigate risks in the bond market.
Performance
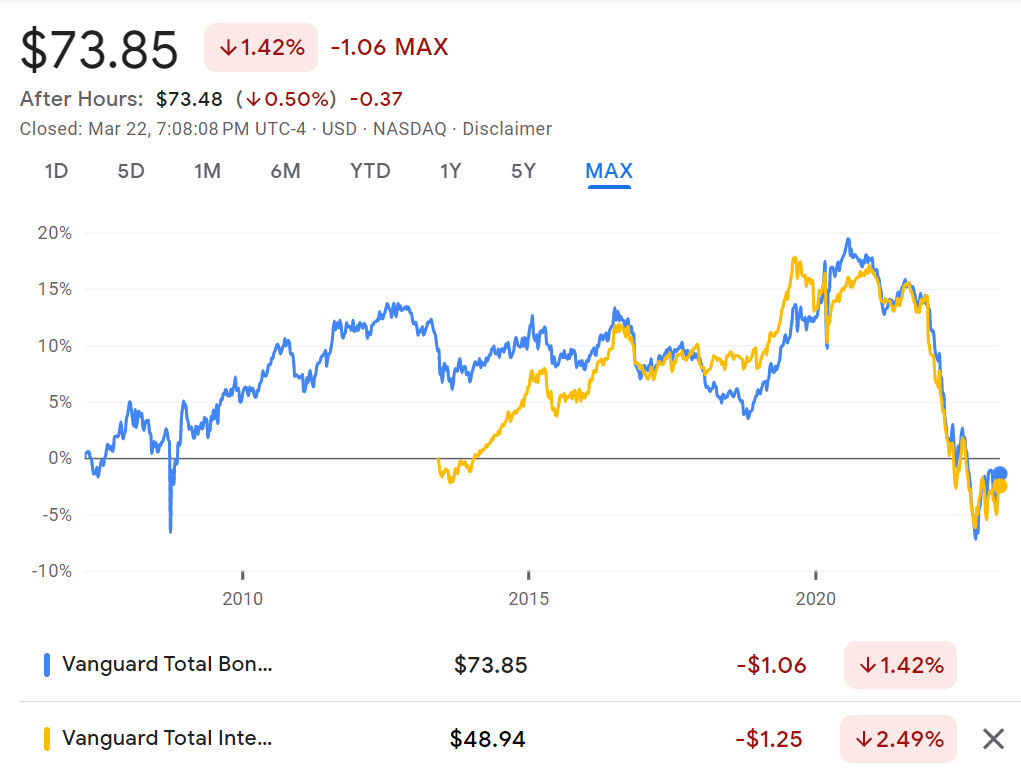
When it comes to performance, BND and BNDX have shown steady growth over the years. However, BND has consistently outperformed BNDX, largely due to the strength of the U.S. economy and the U.S. dollar.
In the past 5 years, BND has returned an average annual rate of 4.23%, while BNDX has returned 1.31%. However, it’s important to note that past performance does not guarantee future results.
Annual Returns
Over the past decade, BND has shown consistent annual returns ranging from 2.09% to 8.72%. In contrast, BNDX has had more volatile annual returns, ranging from -3.95% to 9.74%.
While BNDX has the potential for higher returns due to its exposure to international bonds, it also carries a higher level of risk.
Dividends
Both BND and BNDX pay out dividends on a regular basis, with BND offering a slightly higher yield of 2.69%. BNDX has a dividend of 1.55%.
BND vs BNDX the Final Verdict
When it comes to choosing between BND and BNDX, investors should consider their investment goals and risk tolerance.
BND provides a diversified exposure to the US bond market, while BNDX offers exposure to international bonds.
Both funds have similar expense ratios and dividend yields, but BNDX has historically performed better than BND.
Ultimately, the decision between the two funds will depend on an investor’s individual circumstances and preferences. It’s always a good idea to do your research and consult with a financial advisor before making any investment decisions.

